

Revenue and unit sales from five directions.
Five dimensions with a drill-down
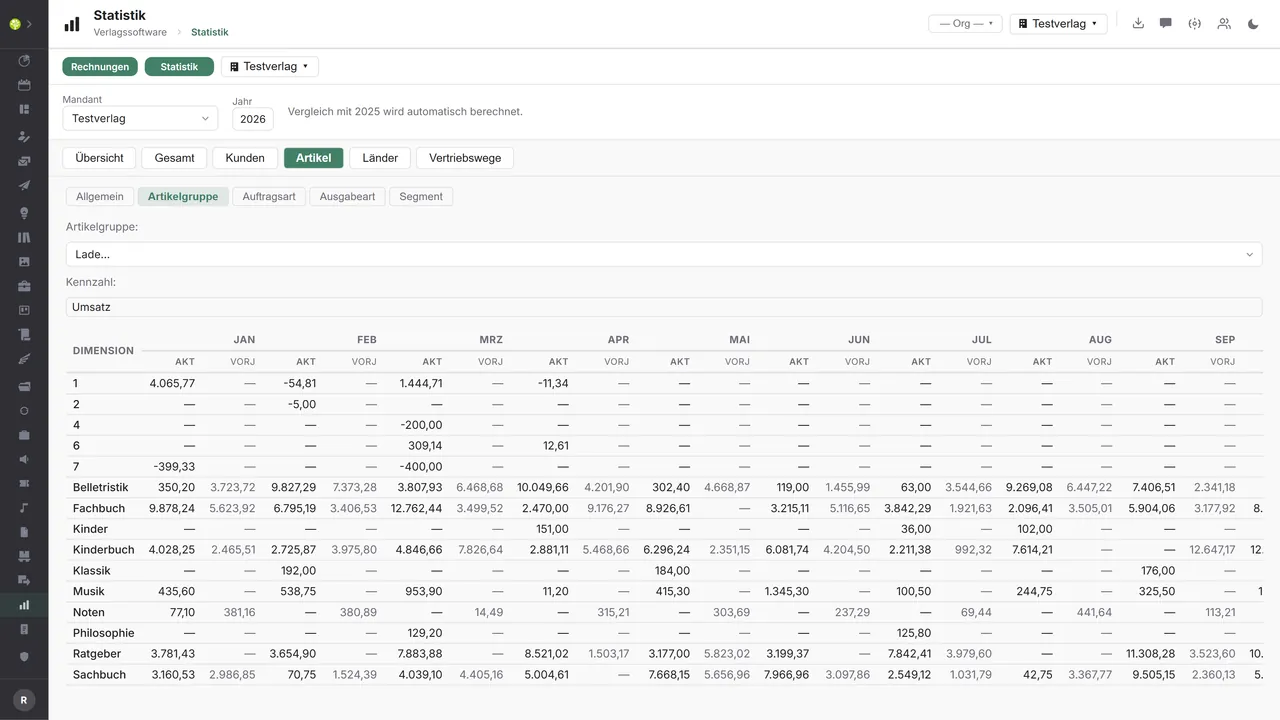
Overall, customers, products, countries and sales channels – and within the products further by product group, order type, edition type and segment.
This year, last year and the budget side by side
Every row shows the current month, the same month last year and the budget, with the variance in euros and in percent – monthly and cumulative.
Revenue on the world map
Countries shaded by revenue, with views for the world, Europe, the DACH region, the Americas and Asia-Pacific – beside them the ten strongest countries.
Export to Excel
What is on the screen goes out as an Excel or CSV file – for the meeting where a spreadsheet is wanted after all.
Figures that tell a story.
A revenue figure on its own says little. Only beside last year, beside the budget and beside an explanation does it become a statement. That is exactly how this module is built.
The data basis is invoice line items, one row per item, with customer, ISBN, title, quantity, price, discount, sales channel, sales rep and commission. They come from invoiced documents in Orders & invoices or by import from a legacy system, where a file is chosen, the mapping profile set and the result checked before it is confirmed. Nothing can be created by hand in the list itself: it serves only to inspect this data basis, not to enter it. Where a link is shaky, the link status says so; from every line item there is a jump back to the order.
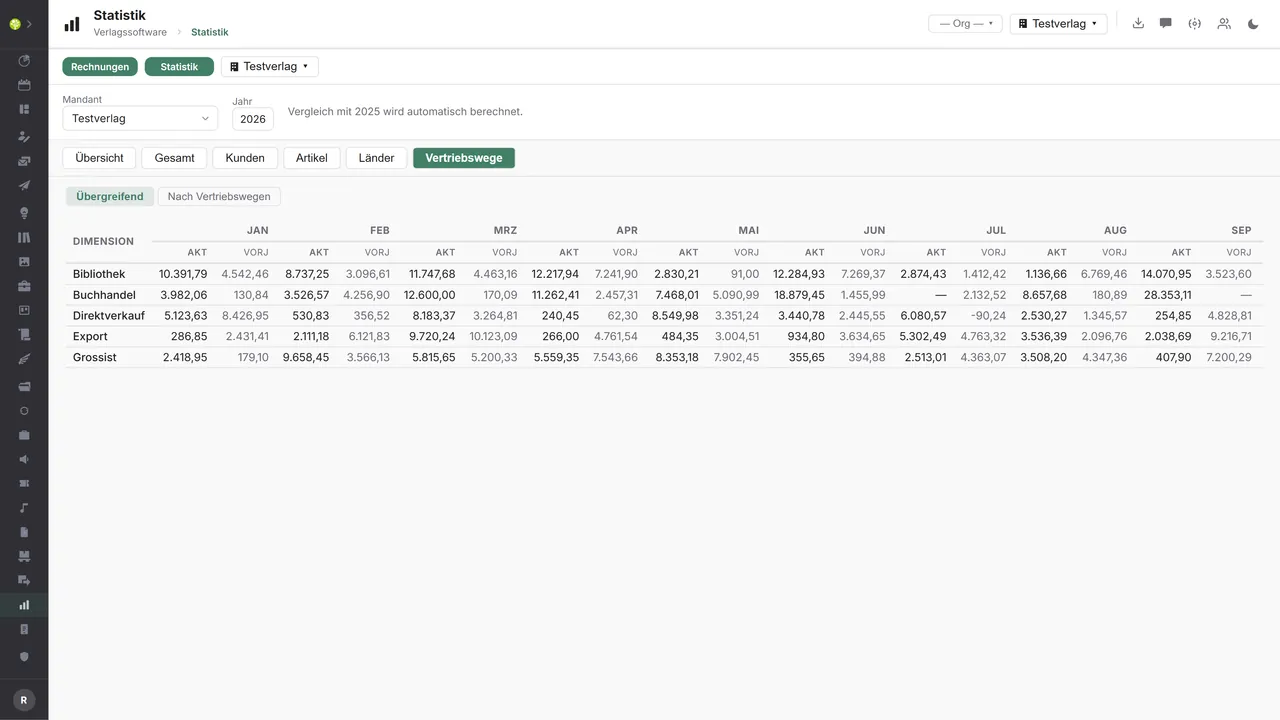
The dashboard analyzes this data from five directions: overall, customers, products, countries and sales channels. You choose the tenant and the year; the module adds the previous year by itself. Every table puts the current value beside the previous year's value month by month, in the overall tab beside the budget as well, with the variance in euros and in percent. Within the products it goes on by product group, order type, edition type and segment; the titles for them come from title data, the customers from the CRM.
The countries tab can do more than a table, namely a world map shaded by revenue. You choose the metric, the country dimension (country of invoice or country of delivery), whether the figures are shown absolutely or as a change against the previous year, and how the classes are formed, as quantiles, natural breaks, linear or logarithmic, for instance. Along with that come views for the world, Europe, the DACH region, the Americas and Asia-Pacific, a display as areas or as circles, and a switch to the table at any time. Four key figures stand above it: total revenue with a year-on-year comparison, the number of countries with revenue, the strongest country and the share of foreign sales.
You maintain the budget in the module itself, per year, per dimension, month by month, with an annual total. It is therefore not a year-end exercise in a spreadsheet but runs along in the planned/actual comparison. And where a month is out of line, the comment hangs directly on the row. It is written, changed and deleted where the variance shows up, instead of in an e-mail alongside.
For line items with a service period there is accrual allocation, first as a preview for a period, then as a run. An annual subscription does not land in the invoice month as a whole but is spread over the months in which it is delivered. Reading is open to anyone who is signed in and has a tenant; only administration may write budgets and delete invoices.
Reporting in the application.

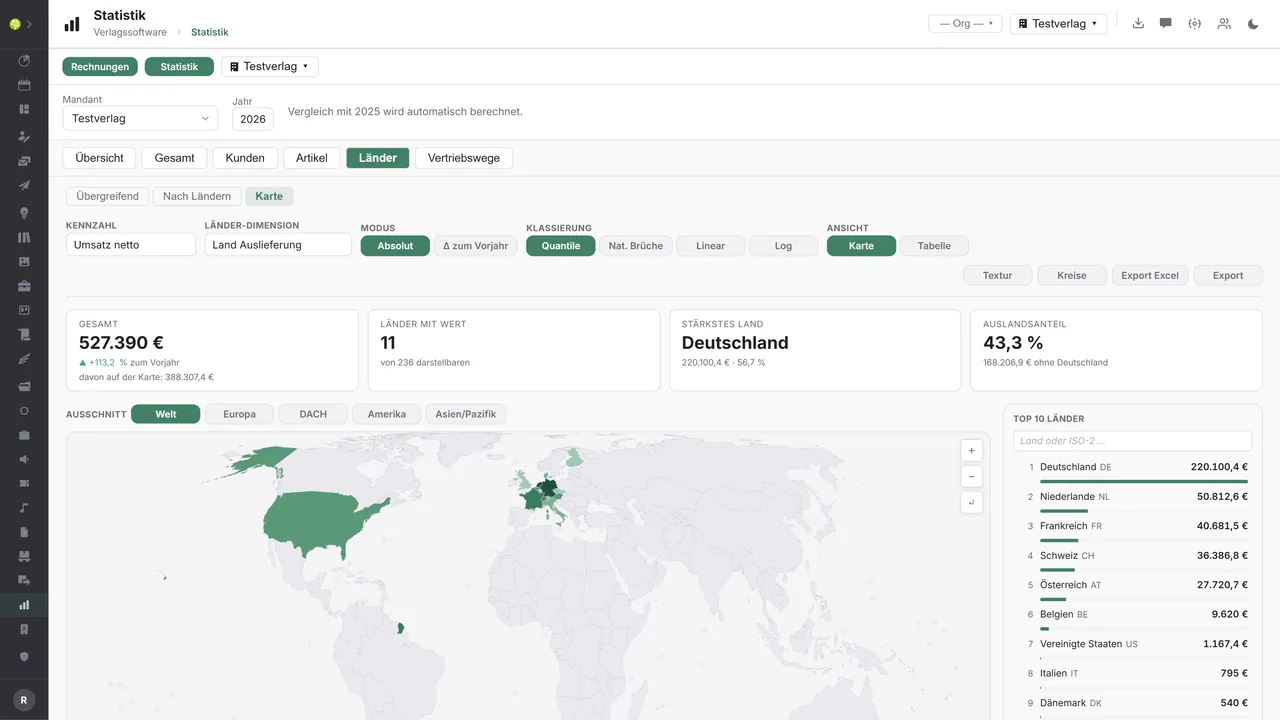

Revenue on the world mapMetric, country dimension, absolute or change against the previous year, class breaks by quantiles, natural breaks, linear or logarithmic – plus views from the world to Asia-Pacific, areas or circles, and the switch to the table.
Every sales channel, every monthLibrary, book trade, direct sales, export and wholesaler – per month the current value beside the previous year's value, across all channels or for each one on its own.
Product groups against the previous yearFiction, professional books, children's books, classical, music, sheet music, how-to and nonfiction – the same monthly logic, switchable to order type, edition type or segment.

See open.junixx at work. We show you on screen how the software fits your publishing workflows – with no obligation, and with time for your questions.
Book a demoImport and export through the API.
The way in is built: invoice data from legacy systems comes into the module through mapping profiles. Going out, it is mainly the connection to BI tools and to industry reporting that pays off.

Import – from external services
Data flowing into the module from outside:
- Invoice line items from legacy systems as CSV or Excel → a historical and current revenue basis, over 90 columns too
- Sales figures from trading partners → sell-through beyond your own invoices
- Market and benchmark data from market research → your own revenue in relation to the market
- Budget targets from planning → a planned/actual comparison with no retyping

Export – to external services
Data the module passes outward:
- The analysis on screen as an Excel or CSV file → carry on calculating where you have to
- Aggregated revenue and unit sales data to BI tools and a data warehouse → analysis beyond the boundary of the publishing house
- Unit sales per ISBN and period to market research and bestseller lists → taking part in industry reporting
- Revenue totals and budgets to accounting and controlling → one source for every figure
What is built today is the way in: CSV and Excel import through mapping profiles, including a profile for legacy data with over 90 columns, in two steps of upload and confirm. Going out, the country analysis leaves as an Excel or CSV file. A continuous interface for BI tools, unit sales reporting to market research and bestseller lists and an automatic management report are not connected today – the analyses are already available in aggregated form for that and can be provided through the central API.
More on the interfaces
Detailed overview from the interface analysis: sources for import and possible targets for export.
Import – from external services

| Source (external) | What is imported | Use in the module |
|---|---|---|
| Legacy and upstream systems | Invoice line items as CSV or Excel | A historical and current revenue basis |
| Trading and distribution partners | Sell-through sales figures | Unit sales beyond your own invoices |
| Market research | Market and benchmark data | Your own revenue in relation to the market |
| Budget planning | Budget targets | A planned/actual comparison with no retyping |
Export – to external services

| Purpose / trigger | External service (examples) | What is exported | Format / standard |
|---|---|---|---|
| Process the analysis further | Excel, spreadsheet | The analysis on screen | Excel, CSV |
| Analysis and reports | Power BI, Tableau, Looker, data warehouse | Aggregated revenue and unit sales data | CSV, JSON, OData |
| Industry unit sales reporting | Media Control, GfK Entertainment, Buchreport | Unit sales per ISBN and period | CSV, reporting format |
| Sales reporting to the trade | VLB and MVB, METIS | ISBN unit sales | CSV, REST API |
| Accounting and controlling | DATEV, controlling tools | Revenue totals and budgets | CSV, DATEV |
Every feature of Reporting.
You will find the complete list in our brochure
What you see above is an excerpt. Every feature of this module – and of all the others – is collected in the open.junixx brochure. We will gladly send it to you, in print or as a PDF. And if you would rather watch than read: we are happy to show you open.junixx live on screen.
Get the brochureCounting revenue is something every publisher must do.
Whether books, sheet music, issues or licenses – the question is always the same: how does the month stand against last year and against plan, and why?






Connected to the publishing ecosystem
- VLB
- IDNV
- doctronic
- Amazon
- Bookwire
- Arvato / VVA
- Brocom
- Prolit
- Zeitfracht
- Magento
- WordPress /
WooCommerce - Shopify
- Shopware
- Wirth & Horn
- Diamant
- DATEV
- BMD
- Abacus
- DHL
- DPD
Get to know open.junixx.
Arrange an appointment with no obligation. We will show you how Reporting fits into your publishing routine.